the NAVIGATION section:
The navigation-section
offers controls to navigate through
your data, to set the scaling of the time and amplitude axes, and to
define segments of interest.
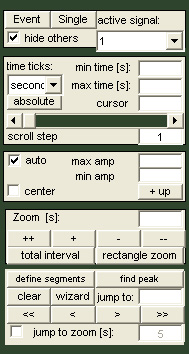
Many of the elements of the command window are self explenatory,
some others however are not. Most important of these are the controls,
that define the layout of the data window, namely the
'Raw/Event'-togglebutton
and the 'single/Multiple'-togglebutton,
both
in the navigation-section.
the Raw/Event-button
'Raw'- vs. 'Event'- display type: In many analysis types, data is
originally loaded from file as a stream of values sampled at a given
frequency. During the analysis, this initial signal is examined for
specific properties, events, distances, amplitudes etc. These
features can then in turn be plotted over time, although they may not
be sampled with a constant frequency (like for instance the interbeat
interval (the distance between two ECG-R-Waves), that is sampled with
every new heartbeat varying in duration). The former kind of
signal in anslab is considered to be of 'raw' signaltype, the latter is
referred to as 'event' signaltype. The 'Raw/Event'-togglebutton
switches between the display of these two types of data. Note that
switching between the 'Raw' and 'Event' display type leaves the
time range of the displayed data segment unchanged, allowing you to
directly compare the raw and the calculated traces at corresponding
points. Note that both, the 'raw'- and the 'event'-mode offer signal
editing options. Changes made in the 'raw'-data-mode are updated in the
'event'-parameters. This, however, does not hold true for the other
direction: changes you make in 'event'-mode are not transferred to the
'raw'-signal. Therefore it is generally recommended to first edit data
in 'Raw'-mode, and use 'Event'-mode-tools afterwards.
the single/Multiple-button &
the out_of_ x_display_only-control
'Single'- vs 'Multiple' - display type: if for both the 'raw' and the
'event' datatype there are more than one signal, these can plotted each
on a different axis or all on a single one. This is defined with
the 'single/Multiple'-togglebutton (If only one signal is available,
this button has no effect). If a single axis is activated, and
the
'display-only-checkbox
is checked, only one variable will be plotted. You can specify
which one by
choosing the corresponding number from the adjacent 'active signal'-dropdown-menu.
Please note that from a
hierarchical point of view, the
Raw/Event-button is the highest button involved: the
single/multiple-state and display-only-state are stored separately for
the 'Raw' and the 'Event' mode, allowing you to select a preferred
layout for each mode independantly and quickly switch between the
two without having to adjust their single/multiple-state and
display-only-state. Thus, if you change from 'raw' to 'event'-mode, the
single/multiple-button and the display-only-button will be set
automatically to their last state in the 'event'-mode.
the active-signal-popumenu
When several signals are available for the Raw- or the
Event-mode, scaling- and editing-operations work on the variable
selected in the 'active set:'-popupmenu.
When the 'Single'-display mode is selected, this is primarily displayed
and cannot be hidden. When displaying 'multiple' axes, one of them
contains the active variable - only in this axes can editing/scaling
operations be performed. Thus, when changing the active variable,
amplitude information is updated in all controls to relate to the now
selected signal. This holds also true for the 'auto'-scaling- and the
'center'-scaling-checkboxes, the states of which are recorded
separately for each set in the RAW and EVENT mode.
the 'time ticks'-popupmenu
The 'time ticks'-control
gives you the choice to display timing information in hours, minutes,
seconds or milliseconds. Zoom- and time-related controls are updated
accordingly as ar time axes in the data window.
the
'min time'- and 'max time'-editcontrol
Using these two
fields, you can manually set the left and right limit of the time axes
in the data window. Changes in either one will also alter cursor-time,
which corresponds the midpoint of the displayed window.
the 'cursor time'-editcontrol
'Cursor time' here refers to the midpoint of the
displayed data segment. Manual changes of the cursor time, will move
the displayed window to the entered midpoint, leaving its range/zoom
(in seconds) unchanged.
the timing scroll bar and the 'scroll
step size:'-editcontrol
Changes of the scrollbar
position are similar to changes of the cursor time: the center of the
displayed data segment is shifted left or right, without changing its
width. Clicks on the arrows result in smaller steps than clicks in the
bar area. Both types of steps can additionally be scaled using the
'scroll step size'-control. Changes of the zoom will also alter
step sizes, as symbolized by increased size of the scroll bar position
indicator.
the
'auto'-checkbox
Auto stands for automatic scaling. When checked,
this causes anslab to dynamically set upper and lower limits of the
y-axis depending on the range of given data. When disabled, the lower
limit is taken from the 'min amp'-editcontrol, the upper limit from the
'max amp'-editcontrol.
the
'center'-checkbox
When checked, the limits of the y-axis of the
active variable are set symmetrically to zero, the absolute value of
the upper and lower limit taken from the maximum absolute value of
either the given data or the user entered limits.
the 'max amp'- and the 'min
amp'-editcontrols
'Both edit-controls are only accessible if
automatic scaling for the active variable is deactivated. You can then
enter custom upper and lower limits for the axis of the active variable.
the '+/- up'-button
this button switches
between positive or negative y-values plotted in upward direction.
the
'zoom'-editcontrol
Zoom here referes to the length of the displayed data
segment. It is given in units defined by the 'time ticks'-control. Manual
changes will allter 'min time'
and 'max time', while
leaving 'cursor time'
unchanged, unless beginning or end of data is reached.
the total interval-button
If you wish to zoom out to display the total length of the loaded
data, select the 'total
interval'-button in
the 'zoom'-section.
the rectangle zoom-button
Use this button to zoom in on an area defined by a rectangle drawn
with the mouse. The vertical extent of the rectangle is ignored, only
the horizontal extent is taken to set the beginning and end of the
shown interval.
the define
segments-button, the 'jump to segment'-box and the
buttons '<<', '<', '>', and '>>'
this button allows you to define segments, that you can then zoom in on
easily and jump from one to the another. This can be useful for
instance to easily zoom in on signal segments, that look suspicious or
possibly artifactual. After you hit the 'redefine segments-button, you
define intervals of interest by clicking to the left and right of the a
segment you wish to explore. Blue
lines will appear at these points, marking the beginning and end of the
segment definition as shown in the graph below:
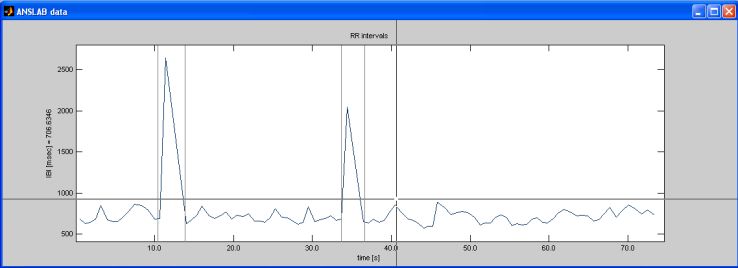
By clicking outside the axis area, you finish defining segments.
Intervals will be highlighted with a blue background color.

You can then navigate between these intervals, by using the
'segment' section on the command window: the currently displayed
segment number is shown in the 'jump to segment'-box, the
buttons '<<', '<', '>', and '>>' can be used to
move to the first, the previous, the next and the last defined
segment. You can also
right-click on the blue background of a marked interval, and
select 'zoom in' to zoom in on this segment. The
zoom will be set automatically so that
the selected interval will fill the entire data window. You can
override this behavior by activating the 'jump-to-zoom'. When
active, this will cause the display window to begin
jump-to-zoom/2-timeunits before the center of the chosen segment and to
end jump-to-zoom/2-timeunits after the center of the chosen segment.
the find peak-button
This button lets you define segments automatically, by looking for
'peaks' in a signal. This is meant for digital channels (like a marker
or trigger signal type), and does not work on a continuously changing
analogue signal. You can specifiy a threshold value to be used as
criterion for peak detection. At the present change, only 'absolute'
peak types with a simple threshold are supported.
the segment
'wizard'
This button lets you create intervals automatically. You can either
divide the length of your file in a fixed number of intervals, or
create intervals of a given length, until the end of the file is
readed. This is mostly necessary when  exporting values for
statistical analysis from average event related responses.
exporting values for
statistical analysis from average event related responses.