the EDIT section:
The edit-section
offers tools to modify data, either the raw signal or calculated
variables. Note that some functions are present only for certain
analysis types: e.g. breathing cycle options are only available when
analyzing respiration data.

the 'active event'-dropwdownlist
If multiple event types are
available, select the one you wish to edit. The active event markers will be
activated for drag-and-drop, insertion and deletion.
the 'insert'-button
Use this button to insert an event
(e.g. an R-wave-marker) by clicking with the mouse on a desired
position on the graph of the active variable.
the 'insert 1'-button
If you wish to insert an r-wave marker exactly between two adjacent
markers, select this button and click on the left half of the interval enclosed
by the two markerks
the 'insert 2
'-button
This works exactly like 'insert 1' except that two markers will be
inserted so that the interval is evenly divided in thirds.
the 'insert on peak'-button
This button looks for a local maximum near your mouse click and sets
the r-wave on this maximum.
the '< insert'- & the '
insert >'-button
These two buttons
are used for inserting r-wave-markers at a distance from a given marker
that is decuded from preceding/subsequent present markers. If you have
for instance a long interval of non-recognized r-waves, you can use
these button repeatedly to fill the interval with a heart rate given
before or after the blank period.
the
'delete'-button
Use this button to delete an event
(e.g. an R-wave-marker) by clicking with the mouse on a desired
marker on the graph of the active variable.
the
'delete-box'-button
use this option to delete multiple r-wave-markers at a time, by
drawing a rectangle around them
the
'exclude'-button
The exclusion box-tool allows to draw a rectangle with the mouse
around a range of data values, that you consider to be of good quality.
Values outside this range (above or below) are set to NaN. Values left
and right of the drawn rectangle are not modified. This is mostly
necessary if you wish to quickly edit long sequences of data without
going in to every detail.
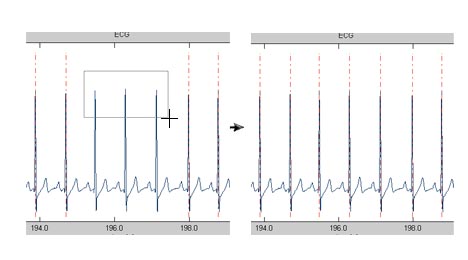
the 'insert box'-button
this option is meant specifically for ecg-data-editing to help you
include multiple non-recognized r-waves, that in general have a normal
waveform, but were missed by the identifaction algorithm. Draw a
rectangle around the maxima of these r-waves, ignoring already
recognized r-waves. anslab will insert one event marker for each lokal
maximum found inside your selection box, that has a minimum distance to
present markers.
the
'define artifact'-button
You can mark artifacts by using the 'define artifact'-button.
After pushing this button, click twice on the data window to mark
beginning and end of the artifact. A horizontal red bar is then
displayed to symbolize the artifact definition. When variables are
saved, artifact intervals will be filled with 'NaN's.
the 'remove artifact'-button
Click on a previously defined
artifact marker to remove it.
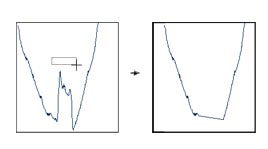
the 'connect'-button
This
tool is a combination of 'exclusion box' and 'interpolate': first
values above or below the drawn rectangle are set to NaN, next these
are interpolated from neighbouring values. You can use this tool to
roughly 'cut' out large artifacts in your data, as shown in the example
on the left.
 the
'draw'-button
the
'draw'-button
this button lets you modify
the loaded signal by drawing lines defined by three clicks on the axis
of the active variable, as demonstrated in the graph on the left.
the 'copy'- and the 'paste'-button
these two button let you first
copy a data segment as defined by a mouse-drawn rectangle and then
paste it to a position again defined by a mouse-drawn rectangle.
If the size of the two rectangles do not match, the data segment is
resampled to have the correct length, stretching or compressing the
waveform.
the 'low smoothing'-button
transformes the signal in a
mouse-drawn rectangle with a moving average, smoothing out sharp
corners.
the 'high smoothing'-button
same as 'low smoothing', only
the moving average is calculated several times.
the 'interpolate'-button
this button interpolates NaN
values in the time range defined by a mouse-drawn rectangle from
surrounding non-NaN-values.
the 'synchronize'-button
this button synchronized
NaN-values among several calculated traces. This is most useful for
multiple variables, that depend on the same raw signal, like
respiration variables: if the raw respiration signal is artifactual,
the calculated variables are all invalid. Synchronizing lets you then
transfer NaN-segments to other traces, so you only have to edit an
artifact once.
the 'restore'-button
this button restores all RAW-
and EVENT traces from an initial copy that is created directly after
loading.
the 'undo'-button
this button executes commands
to undo editing operations (under construction). While the button is
active, you can go back further. Only operations of the
'editing'-section can be undone, and you can only go back until the
last 'Resumpoint'. You can go forward in editing history using the redo
button.
the 'redo'-button
this button executes commands
to redo editing operations that were previously undone with the
'undo'-button.. While the button is
active, you can go forward. Keep in mind that once you perform a
new editing action at a midpoint of the editing history, all later
'redo'-actions are deleted.