Phase designs
Extracting values of extracted parameters (event traces) for statistical analysis requires timing files for each associated raw-data file and analysis results for the channels of interest (mat-files). Timing files should contain equal number of intervals for every file, missing data can be included by using NaN's for start time, end time and duration as shown below:
T = [...
2
29.42 149.92 120.5;...
3
377.23 617.73 240.5;...
4
793.69 914.19 120.5;...
1
1089.87 1270.4 180.53;...
5
NaN
NaN
NaN;...
6
1767.45 1887.95 120.5;...
7
1993.49 2113.99 120.5;...
8
2409.29 2529.79 120.5;...
9
2717.56 2898.06 180.5;...
10
NaN
NaN NaN;...
11
NaN
NaN NaN;...
12
NaN
NaN NaN];
If timing files do not contain an equal number of intervals, the maximum of intervals is taken, and undefined intervals are filled with empty cells. Select the study folder you are working with, choose the correct dataformat and load a filematrix of raw-filepaths, that you wish to extract values of. Note that although you select a batch of rawdata-files, values are extracted from dependant mat-files. The procedure is starting from raw datafiles, as, together with a given study folder, anslab can find all dependant mat-files automatically.
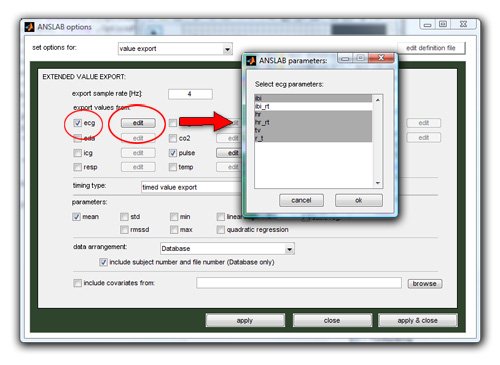
You configure the value export using the value export-page on the options dialog as shown below. Check the channels you would like to export parameters from, push the edit button next to the channel checkbox and highlight those parameters that you would like to export. Hit the "ok" button to close the parameter dialog and hit "apply" to save the settings.
Next, you select which kind of timing type you have in your data. In most cases you can leave this option on the default setting (timed value export). If however you have edited only parts of your data using timing files, or have recorded only selected intervals during your experiment, you must select a different timing type. The 3 different types are explained below, and describe different arrangements of rawdatafiles, timing files (.m) and result files (.mat):
| timing
type |
raw
data files |
timing
files |
result
files |
| timed
value export |
(usually
large) raw data files that were processed as a
whole |
timing
files were not used
during processing, but are now used for value
extraction for each defined segment |
one result
file per raw data file, named '*00.mat' to denote that raw data
files were processed as a whole |
| timed
rawdata files |
(usually
small) raw data files that were processed as a
whole, but already contain only data segments of interest |
timing
files were not used
during processing and are not used for
value extraction; one value per channel is extracted for each
file |
one result file per raw data file, named '*00.mat' to denote that raw data files were processed as a whole |
| timed
analysis segments |
(usually
large) raw data files that were processed
segment by segment |
timing
files were used during
processing to edit only defined segments and create one result
file for each segment; timing files are not used
for value extraction; |
multiple
result files (one for each segment) per raw data file, named
according to the segment number (e.g. '01.mat') |
You also need to select which type of values you wish to
export. The mean across the defined interval is the standard
recommended option. You can however also choose to export the
standard deviation, the root-mean-square successive difference, and
linear, quadratic and cubic regression
information (coefficients and
residuals), minimum and maximum. For each value type a separate
text file will be saved
(except when using the database format, see below). Note that this
dialog is not effective for icg and spectral data export, as only one
parameter for each segment is available.
The data arrangement in the export file can be selected from the
data arrangement dropdown box. Database format (the default option,
which can be used among others for Excel
Pivottables) will arrange data such that only one combination of File,
Segment and Channel per line is listed, multiple parameters
(e.g. mean, std and linear regression-values) are listed in the same
row. The other arrangements are data tables, the string
before the vertical line determining what varies across the rows of the
data table, the strings on the right denoting the nesting of the column
ordering, with the hierarchically higher factor before the forward
slash.
For the databaseformat, you can also have
ANSLAB add Subject# and Run# information, taken from the
filename, in the database: this can for instance be useful, if you do
not have one large segmented datafile
for each subject, but still wish to analyze multiple files for each
subject as repeated measurements. Using Microsoft Excel pivottables,
you can then rearrange the data of multiple files in one row (as needed
by Statistica or SPSS).
Last, for the database output format, you can choose to supply a text
file with covariates to be incorporated in the data export to save you
the work of
generating the covariate information in the database manually. This
file must be a tab-delimited text file containing one header row. The
first column must be the subject number, all other columns are treated
as covariates.
Start the value extraction with the menuitem \Calculate\statistics export\extended
value export (mat) .
Starting with anslab2.4, the extended value export is the recommended option. However, the former dialog based export is still available with the \Calculate\statistics export\value export (mat) command and will set the above options based on dialog questions on the ANSLAB command window. Please note that this value export will always export the standard set of parameters - you cannot enable or disable signals separately.
Note: Starting with ANSLAB 2.6 release 30 (release 8 in case of the protected version of ANSLAB) the value export already generates data in wide format if you chose to export the data in database format and to include subject information. The respective text file is stored at the same location as the regular export file but the text "_wideformat" is appended to the specified export file name.
In the wide format file there exists one row per subject and the column names are always of the form VVV_PPP_R_MMM_CC with
- VVV is the name of the variable exported (e.g. HR, IBI0 or SCL)
- PPP denotes the statistical parameter (e.g. mean or maximum)
- R corresponds to the run (usually the last two digits of the raw files)
- MMM denotes the marker code for the respective segment
- CC is the occurrence count for a certain marker code (corresponds to ConditionRepeat of the normal database format)
Event-related designs
Select the study folder you are working with, choose the correct dataformat and load a filematrix of ans-filepaths, that you wish to extract values of. Extracting values from event related data epochs also requires a sample ans-file to be loaded in ANSLAB. This file allows ANSLAB to know the number of channels in the data files, the sampling, baseline settings and the active signal, that is to be exported. All files in your batch should have the same number of channel and points and the same data sampling rate.If your ans-files contain only 1 channel, this channel will always be active. If however your ans-files contain several channels, you must select the channel you wish to export as active signal. Next, define intervals of interest, either using the define segments -button, the segment wizard or by loading an interval file. Define baseline interval calculation as needed.
[Top]