What Does This Channel
Measure?
For analysis of pulse plethysmography signals the ECG needs to have
been analyzed. ANSLAB extracts five signals from the raw data: SV
(systolic volume, in
volts), DV (diastolic volume, in volts), PA (pulse amplitude=SV-DV),
PTT (pulse transit time, in msec, measured from the ECG R-wave to the
steepest upstroke in the pulse signal) and HR (heart rate, in bpm). For
editing purposes you mainly need to be concerned with PA, an index of
sympathetically mediated vascular constriction (resulting in smaller
amplitudes) and PTT, a mostly sympathetic index that is related to
factors such as systolic arterial pressure, vascular compliance, and
stroke volume. Shorter PTT values correspond to higher sympathetic
activation of the cardiovascular system.
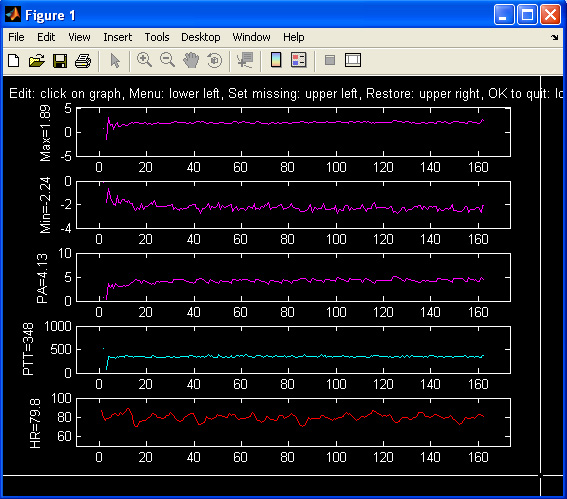
ANSLAB displays the five signals in separate boxes in one window. PA
and
PTT are displayed in the third and fourth boxes from the top.
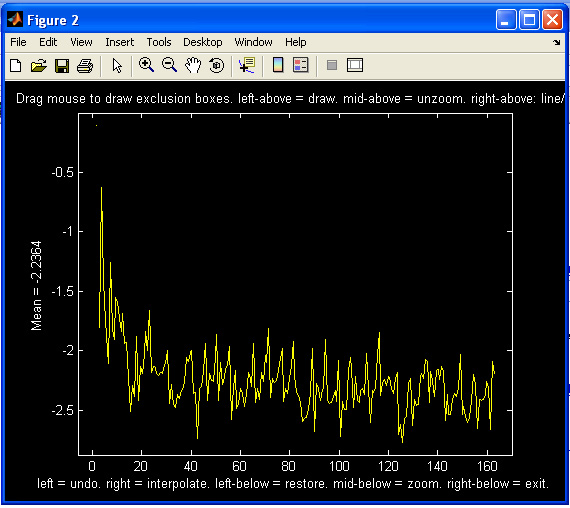
By clicking on a graph, you can zoom in on one variable and draw
exclusion boxes to exlude outliers:
What Kind of Artifacts are
Common in this Channel?
Artifacts in PA (see example below) or PTT appear as unusually large
spikes in either direction. While ‘normal’ values of PA vary by
subject depending on the amplifier gain settings, PTT values typically
fall within a range from 200 to 350 msec. Spikes beyond this range are
almost always artifacts. A variability of 100 msec or less within a
subject
due to heart rate variability is normal and seldomly requires serious
editing.
When you are not sure if something is an artifact, look at the raw data
by clicking in the lower left corner and select option [10]. You will
then be asked to mark suspicious segments by clicking on the left and
right border of the suspicious segment (which can be repeated several
times).
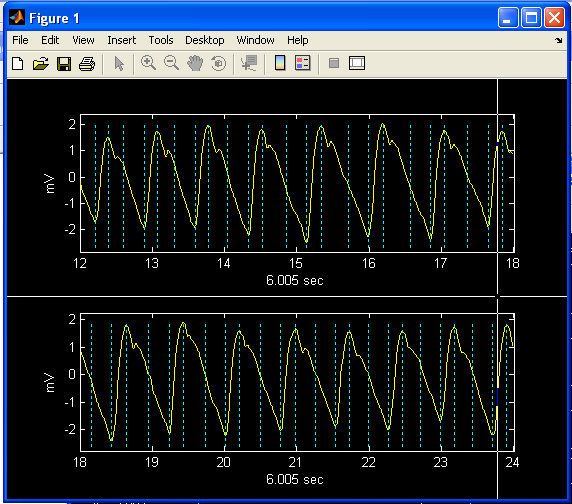
By pressing <0> the segements will be
displayed as raw data in EXAM for further inspection. The figure
contains the raw signal (yellow) and blue lines depicting the
occurrence of the R-wave in the ECG, the following minimum
corresponding to the diastolic value of the arterial pressure wave and
the following maximum corresponding to the systolic value of the
arterial pressure wave. This display mode can help you identify, e.g.,
artifacts due to ceiling effects, which can happen if the amplifier
gains were set to high for a subject.
How Are Artifacts Removed?
Editing PA and PTT is simple. Click on the box display
for the parameter you want to edit. A new window displaying this
data pops
up. Mark the outliers by clicking on an upper threshold left of
the spike, hold the mouse button, and drag the cross to a lower
threshold right of the spike. By clicking, you create a box that
defines the left and right margins, within which all data above and
below the box is set to missing value. If you accidentally exclude too
much, click once in the lower left corner of the window. Data
will be restored and you can try again. By comparing the new mean
to the original mean (displayed with the y-axis label), you can decide
whether the data you excluded were outliers changing the mean. If
not, no further editing is necessary. Click
in the lower right corner to exit editing. Save reduced data.
What Qualities Must Be
Preserved In Editing?
You only need to take out obvious outliers that would distort the mean,
which is displayed at the left side of each graph. When in doubt, don’t
exclude. Also, don’t necessarily exclude ceiling or floor
effects, since this might further distort the mean (because true
extreme values are not only cut by a few percent, but left out of the
mean estimation altogether). Linear interpolation after excluding data
can be done by clicking to the right side of the plots, but usually is
not
necessary.