
What Does This Channel
Measure?
People exhibit in response to a sudden threatening event a whole body
startle response, including increased heart rate, contraction of the
neck muscles, and an eyeblink, among others. Measuring the startle
response is
important in the context of emotion research, as its magnitude is
modulated by affective valence. Roughly, the more negative someone
feels the larger the magnitude of the startle response. Typically,
startle responses are provoked using loud (95 dB), sudden (50 ms)
bursts of
white noise – so-called startle probes. As an indicator of startle
magnitude we use the strength of the eyeblink response, which is
measured with electromyographic (EMG) activation of the lower eyelid.
ANSLAB preprocesses and displays this EMG activation and allows to edit
it for individual startle probes.
Editing of Startle Data:
The raw data file needs to contain a marker channel that indicates
when the startle probe was given. The marker needs to go up when the
noise burst starts and down when the noise burst ends. ANSLAB will
first analyze this marker channel and then, probe-by-probe, load in the
raw EMG data surrounding this probe.
A
window will pop open showing you the first startle probe (=trial)
within this file. You go from trial to trial by just hitting “enter.”
Here’s how to read the startle data display windows:
Upper graph, yellow line = filtered and rectified EMG signal (this is what you should focus on)
Lower graph, yellow line = raw EMG signal
Upper graph:
First vertical blue line =
start of baseline
Second vertical blue line = probe onset and end of baseline
Lower horizontal blue line = startle response baseline (average of the baseline window)
Higher horizontal blue line = indicator for 1 standard deviation above the average baseline
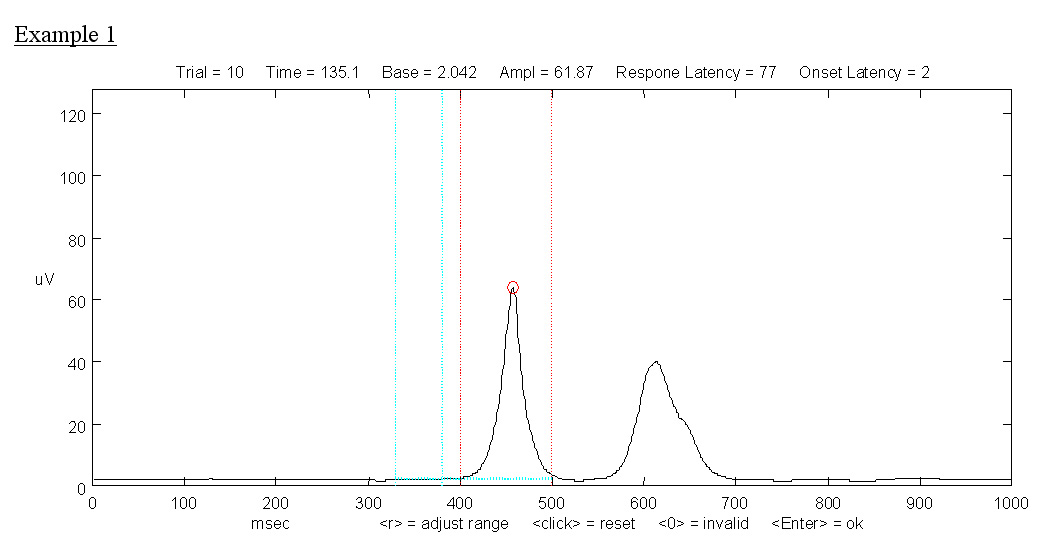
Red area = startle scoring area (ANSLAB only looks for a response in the window between 20 and 120 ms after the tone as this is physiologically the time window we expect a startle response to occur. Sometimes there will be a second, partially voluntary response, after this time window which we do not want to include - see Example 1 below).
The three main variables extracted by ANSLAB are startle
response magnitude (=peak minus baseline value), startle response
latency (from tone onset to peak response as evident in the EMG average
upper window), and startle onset latency (from tone onset to onset of
EMG response as evident in the lower raw EMG window). The highest peak
within the red window should be automatically marked, which will
usually be the correct decision. If not, you can reset a response by
simply clicking with
the left mouse button. If there are two equally plausible peaks pick
the one closer to the normal response time for that subject and above
the 1
SD line [see Example 2 below --> the first response is closer to
this subject’s normal response latency]. If there is no clear
response, click on a clearly identifiable peak that is approximately at
the normal response time for that subject in order not to distort
response latency. Do this only if the standard deviation is low. [See
example 3 below --> this response might justifiably be set a little
later on the second discernible peak if it reflects the subject’s
normal response latency; or alternatively, set to 0 response.] If
the standard deviation is higher (i.e., much higher than any of the
responses in that trial), consider excluding this response by hitting
“i” for invalid, as this response measurement is probably not reliable
due to an instable baseline.
After you have gone through one file trial-by-trial, a window appears
that displays
startle magnitude and latencies for each response. They appear as step
functions, because ANSLAB is set to extrapolate from each response for
the whole intertrial interval.

Some Other Functions:
r: adjust range. You can use this function if you want to have a closer
look at one response. Sometimes a response might be displayed as very
small, because the range is contingent on the largest response in the
whole file. In such cases, you can decrease the y-axis upper limit in
the upper window in order to see better what is going on.
w: adjust response scoring window. You should use this function very
rarely, e.g., when a technical failure for event marking occurred, and
only
when responses clearly lie outside the “normal time window” but not so
far away as to be physiologically impossible. This will let you reset
the start time for the 100 ms red area within which ANSLAB looks for
a
response. The selected value will remain active for the entire file.
b: adjust the baseline definition window. You can use this function
carefully sometimes if there is a short and small EMG burst
during the baseline window, but not during other times. This
baseline noise would result in an overestimation of the baseline mean
and thus an underestimation of the response magnitude. You can reset
the baseline window by clicking on the area in the upper plot where a
normal baseline EMG activity is present. This can be repeated until
pressing <Enter> exits this function. This resetting of the
baseline should be used only in special cases where it is clearly
justified. The typical guideline for dealing with an elevated baseline
is to exclude this trial using option <i> (invalid), since most
baseline "noise" stems from a pre-startle probe involuntary eye-blink.
There is a refractory period after it that makes the startle blink
response less pronounced and thus confounded.
o: adjust the onset latency. This function should be used when the
onset latency estimated in the lower raw EMG window is incorrect (as
e.g., in Figure 2 above). You
can reset the lower graph onset line by clicking at the desired time in
the upper graph. This can be repeated until the placement of the lower
graph line is correct. The function can be exited with <Enter>.
l: adjust the response latency. This function should be used extremely
rarely, if at all, when
the response latency estimation based on the peak is incorrect, but
resetting the peak would result in a misestimation of the response
magnitude. You can reset the response latency time by clicking at the
desired time in the upper graph. This can be repeated until the
placement is correct. The function can be exited with <Enter>.
0: set the response magnitude to zero and the latencies to missing
value. This option should be used if no clear startle response is
discernible. Zero responses can occur within subjects after many
startle tones have been presented in short succession, or in some
subjects that do not have a pronounced eye-blink startle response.
Caution is advised if there is generally no or a weak startle response
in a subject: this might also indicate a problem with the electrode
placement or amplifiers.
i: set all response parameters to invalid (set trial to missing data).
This option should be used if there is so much baseline noise that the
startle response is clearly below the baseline + standard deviation
line. This option also should be used if there was clearly a
non-startle blink
right before or during the startle tone, which would dampen the
response to the noise burst because of a refractory period in the
eye-lid muscles. There are other possible reasons for excluding a trial
which have to be weighed cautiously in each case.
Output of Startle Data:
Ratio adjustment for reactivity scores (task minus baseline) may be
more appropriate than change scores with EMG data. The startle response
magnitude for a given individual depends on many factors: exact
placement of the electrodes, muscle size, innervation density, skin
thickness, etc. All these are probably multiplicative rather than
additive factors for the response estimation. However, often additive
change scores are used in publications.
Editing Examples:
 |
 |
 |